
SOME APPLICATIONS OF IMAGING TECHNOLOGIES IN EXPERIMENTAL GEOTECHNICS
Henderikus G.B. Allersma
Abstract
Digital image processing has proven to be a useful tool in analyzing experiments on geotechnical problems. This technique has been applied in the first instance for measuring the deformation of soil in geotechnical centrifuge tests. The advantage of the method is that only a video camera is required as sensor and that, unlike mechanical sensors, light does not influence the behaviour of the soil. This is particularly important at large gravity levels.
It soon appeared that there are much more applications for this measuring method in geotechnics. In the laboratory the method can be used to measure deformation parameters in soil testing devices. In the field the method is applied to measure the surface deformation of a dike during water infiltration, which can be caused for example by wave overtopping. Image processing techniques can also be used to monitor pollution transport problems in soil.
A more advanced application of imaging technology on granular material can be achieved by using double refractive grains. With this technique it is possible to obtain information about the stress distribution in the interior of the model. By using digital image processing techniques it is also possible to apply this method in a geotechnical centrifuge.
1 Introduction
Imaging technologies can be considered as a universal tool for visualizing, digitizing and analyzing phenomena in experimental research. This observation technique was introduced in geotechnical centrifuge research [1] in order to enable deformation measurements in small samples. In a small geotechnical centrifuge the space for mechanical sensors is limited, so that there are difficulties in monitoring the progress of a test. By using digital image processing techniques, however, it is possible to extract significant data from the images captured by a video camera. Today, small cameras are available which can also be mounted on the arm of a small centrifuge, so that the model can be viewed continuously via sliprings.
As a result of the low cost cameras, several applications become attractive in the laboratory. Examples are: deformations in soil testing devices and the diameter of triaxial samples.
Imaging technology can also be used in field tests. This technique was applied for measuring the surface deformation of a dike during water infiltration.
A missing parameter in model tests on geotechnical problems is the stress distribution in the sample. Normally the stress distribution in the interior of the soil sample has to be estimated form the boundary conditions. This is only possible under very specific circumstances. In some cases, however, information about the stress can be obtained by replacing sand with photoelastic material, such as crushed glass. Stress patterns can be made visible in plane strain deformed samples in this technique. By means of imaging technologies parameters can be obtained in centrifuge tests, which can be used to measure the stress pattern in model tests.
2 Description of system used
For the applications described in this paper a relatively cheap and simple image processing station was used. It was found that an interactive system is most convenient in use but an automated mode was also required in some cases. Therefore a PC based configuration was chosen. The system comprises a PC (i.e. a pentium-200MHz central processing unit with a 4GB hard disk) with a frame grabber (Pulsar from Matrox). The number of pixels in a frame in horizontal and vertical direction can be varied. For these applications, however, frames of 512x512 pixels were mostly used. Each pixel represents a memory address of e.g. 8 bit, so that 255 different grey levels can be recognized. Because the frame grabber has no colour options a black and white camera was used. The frame grabber can control four different cameras. The required properties of the camera depend on the application. In centrifuge tests a small camera is preferred, because it can be mounted easily at specific locations. The smallest camera which is used currently has dimensions d=18mm, l=50mm, and weighs 25 grams. Depending on the problem, it has to be realized that automatic functions, such as black and white balance or diaphragm are not always preferred. An automatic diaphragm is convenient if the camera is used in a field measurement with cloudy weather, so that large differences in illumination can be endured. However, if the system is used to monitor the transport of tracers, e.g. in groundwater flow problems it is not permissible for the black and white balance or diaphragm to be adjusted automatically, because information would then be lost.
A recent development is the application of a non-interlaced camera in centrifuge research. With this camera pictures can be captured from spinning centrifuge models, whilst the camera is positioned at a fixed location outside the spinning centrifuge. The camera is triggered by the centrifuge via the computer and frame grabber, so that an image of the centrifuge model is captured at one specific position. It appeared that a shutter time of 1/4000 sec was sufficiently short to capture a sharp frame at 370 RPM. At that particular position the model can be illuminated by a powerful light source, which can also be located at a fixed place outside the centrifuge. With this technique it is easier to provide a homogeneous illumination of a large surface. A uniform illumination is important if e.g. the grey level distribution is used to measure the concentration of a contaminant in two dimensional pollution transport tests.
The analysis of images is easier if a good contrast is obtained, between significant and non- significant objects. However, the contrast can be optimal in the first instance, but the progress of the test can influence the contrast in a negative way. Furthermore, variations in illumination can occur in field tests or if the sample is spinning around in a geotechnical centrifuge. In general, the negative effect of the disturbances can be eliminated by software.
Since the elementary operation of the frame grabber board is specialistic a software toolkit is recommended for manipulating the images. In the applications described in this paper the toolkit TIMWIN (Difa Vision Systems) is used. This toolkit supplies the user with a large number of commands to manipulate images, e.g. subtraction, threshold, skeletonizing, noise filters, etc.. This program can be used interactively, but it is also possible to make a script file to process the images automatically. In both modes, the result of each operation is visible on the monitor. The commands of the toolkit make it possible to extract relevant information from the images. In most cases the extraction of information is, in principle, simple. However, due to all manners of disturbances several extra processing operations are necessary. In combination with a normal camera 5 frames per second can be stored on disk.
3 Deformation measurements
In many applications imaging technology can be used to determine deformations in soil samples. This technique is attractive because detailed information in a large area can be obtained with
Fig.1 Geotechnical centrifuge of the Delft University of Technology.
only one sensor. Furthermore light does not influence the measurement, which is very important in tests at high gravities.
3.1 Centrifuge tests
Centrifuge research is an effective method for performing small scale tests on constructed facilities whose behaviour is strongly dependent on the properties of the soil. In a centrifuge test the self weight stress in the soil body is the same as in the prototype problem, so that a realistic behaviour of the soil can be simulated. In order to reduce the cost of operation and sample preparation time a small geotechnical centrifuge (Fig.1) has been developed at the Geotechnical Laboratory at the University of Delft [2]. The centrifuge has a diameter of 2.5m and can accelerate samples with a dimension of 400x150x300mm and a weight of 400N up to 300 times earth gravity. Several miniature computer controlled accessories [3] are available to perform advanced in-flight tests, e.g. two dimensional loading system, sand pouring machine, air supply system, water circulation system, pile driving device, etc. In a small centrifuge, however, the space for sensors is limited. This disadvantage can be overcome by using digital image processing for measuring displacements and other phenomena.
The displacement can be related to the movement of an object or to markers located on a clay or sand sample. A simple and effective method of observing the progress of a test in real time is by subtracting images of two different stages. It can be visualized how the deformation proceeds and which region is affected during the test. In particular when the displacements are small and occur slowly it is difficult to follow the test by eye.
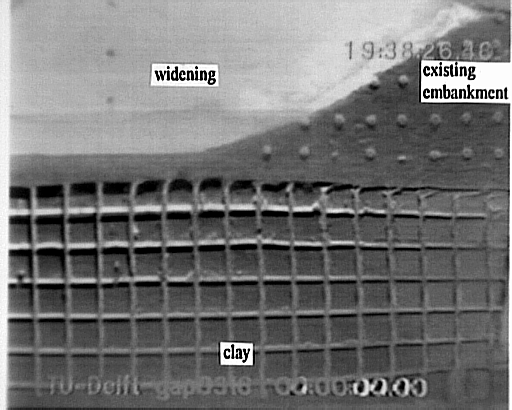
An example of a test on sand with a tunnel with decreasing diameter and of a two dimensional test on the widening of a sand embankment overlying soft clay is shown in Fig.2. In the tunnel test the sand sample is marked with thin layers of black coloured sand. In the widening test the boundary of the clay layer is marked with a grid of paint. The distance between the grid lines in Fig.2b is 10mm. It has to be realized that sample preparation and test technique is an important part of the measuring technique. Boundary effects have to be avoided to be sure that behaviour of the visible soil surface is representative for the interior of the sample. In order to reduce boundary effects a special technique [3] has been developed to copy the grid to the clay boundary without removing the transparent wall.
In both tests the subtraction operation yields information about the mechanism. In the tunnel test for example it can be seen which area is affected by the volume decrease of the tunnel tube. Also the change in diameter of the tunnel is visible. Furthermore in the upper left hand corner the

a b
Fig.2 Visualization of the deformation in centrifuge tests by subtraction. a) Tunnel (d=30mm) with decreasing diameter in sand; b) widening of sand embankment on soft clay.

a b
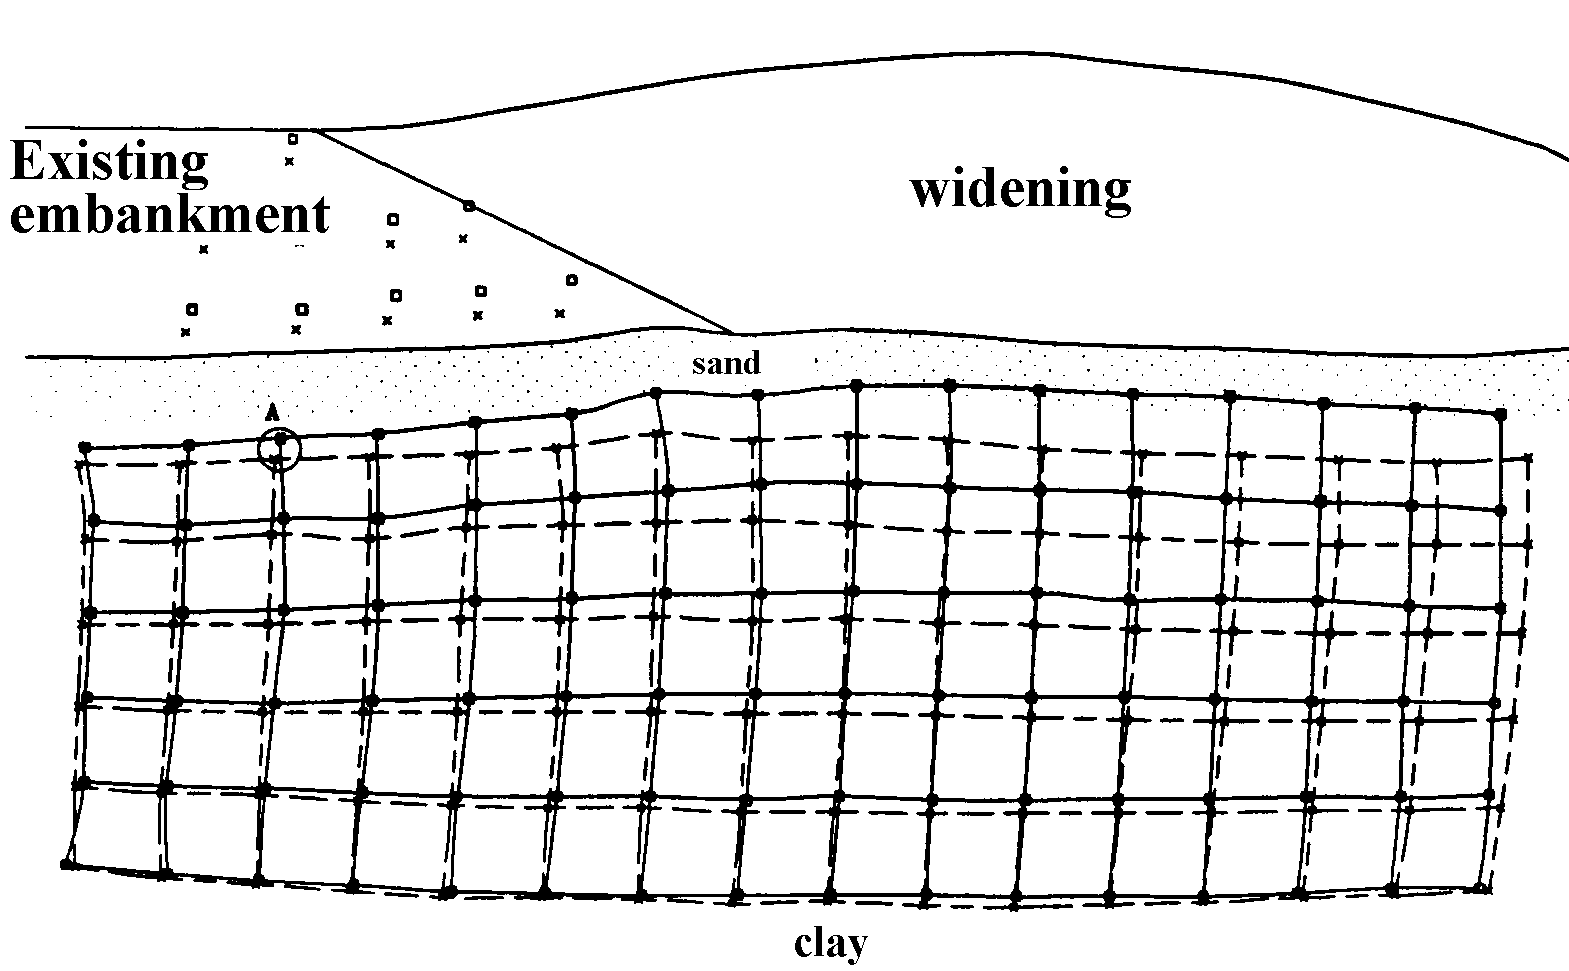
Fig.3 a) Extraction of the grid at the clay surface. b) Computer plot of the digitized geometry of a road embankment widening test at 100g in a geotechnical centrifuge.
settlement of three heads of foundation piles are visible. The piles are loaded to the same value; before and after decreasing the diameter of the tunnel at 100g. In the widening test mainly vertical displacements can be observed under the existing embankment.
In Fig.3 an image of the widening test is elaborated further. The grid is separated from the background, by using a threshold command. With this command only a specified range of grey values is left. After extracting the grid from the background the lines can be skeletonized (lines with a thickness of one pixel remain). If there are some unwanted objects left which are not connected with the grid, the size of the objects can be used to make a choice between relevant and non-relevant information. In Fig.3a two stages are combined. If the skeletonized lines are available using a command, which erases pixels with less than three neighbours, can isolate the nodes of the grid. Some simple commands are available to digitize the nodal points. The process described can be carried out automatically. In Fig.3b the digitized geometry is used to make a computer plot of the widening test. Also the boundary of the sand layer is digitized. By means of this measuring technique it can be shown that cracks in an asphalt layer which covers the original sand embankment are not a result of horizontal displacements but are caused by a gradient in the vertical displacement underneath the embankment [4]. Thanks to the imaging analysis it can be shown that the gradient can be influenced by the method of widening. The differences in the gradient were only a few degrees, so that accurate modelling and measuring is


a b
Fig.4 Monitoring of the penetration of a suction pile at 150g in a centrifuge test.
required. If an area of 150x100mm is considered, displacements of 0.3mm can be measured. The accuracy can be increased, by using more cameras to view smaller parts of the significant area.
In Fig.4 the simulation of the penetration of a suction pile (at 150g) at the sea floor is observed during installation in sand [5]. The pile is installed by pumping the trapped water out of the pile. The generated pressure difference and the reduced friction by the enforced groundwater flow causes penetration. By means of a simple measurement using the cursor, sufficiently accurate data could be obtained about the penetration depth in time. Since the test proceeds rather fast (the whole installation takes about 3 sec) the process was recorded on video tape first (25 frames per second). Next the frames were analysed one by one, so that sufficient measuring points could be obtained. The measured displacement of the pile is linked to other process parameters by means of the time. A typical output of a test is shown in Fig.4b.
3.2 Laboratory tests
The applications in the laboratory have mainly been devoted to the measurement of the surface deformation of soil samples in testing devices. The method is for example used to check the uniformity of the deformation of clay samples in a biaxial apparatus. Another application is the measurement of the diameter of cylindrical samples in a triaxial apparatus. Since a cylindrical confining cell distorts the sample dramatically [6] a rectangular cell was built with two transparent walls. By creating a suitable background the diameter (ca. 40mm) of the sample can easily be determined by processing the image. Data for correcting distortion (due to the glass wall and to the lens) can be obtained by placing a grid with known dimensions close to the relevant object. If the full scale of the frame is used the diameter can be measured to an accuracy of 0.2mm.
3.3 Field tests
Digital image processing can be used in field tests in order to measure the movement of soil structures. The advantage of this method is that the object can be observed from a distance and a more or less continuous measurement can be realized. An example of a field test is a dike subjected to water infiltration. In order to be able to measure the surface deformation the slope was marked with labels (Fig5a). It was found empirically that a white plate (300x300mm) with a black spot with a diameter of 100mm could be isolated most easily by means of image processing commands. The length of the slope was approximately 10m. The images were grabbed with a camera located at a distance of 30 m from the labels. By subtracting images, displacements of 5mm could be made visible in real time. During the test images were stored on the hard disk with


a b
Fig.5 a) Computer plot of digitized displacement of one label. b) Addition of the photograph and b) the digitized position of a label at different time steps.
a speed of 1 image per 3 seconds. Afterwards the images were analyzed, where it was possible to digitize the co-ordinates of the black spot of the labels automatically. Specific problems in the image analyzing process were; changing light intensity (partly cloudy sky), people who where walking around, strong wind moving wires and grass in the background. After several different operations the threshold value was decreased step by step until 18 objects were left, being the number of placed labels. In most cases the isolated objects coincided with the labels. The digitized coordinates of more that 1000 exposures were used to make a time- displacement diagram of each label. An example is shown in Fig5b. In Fig.5a the isolated marks are added to the photograph of the dike, so that the failure mechanism could be made visible. It appears that failure starts at the surface, where the clay layer, which covers the sand body, moves downwards parallel to the slope. Contrary to the conventional hypotheses, failure did not start with a deep shear band. However, if the observation had not been made in this way the mechanism would not have been clear, because after the event it looks as if a deep shear band failure had occurred.
4 Pollution transport in soil
In co-operation with the European Commission funded Network of European Centrifuge for Environmental Research (NECER) a test program has been carried out in the centrifuge to simulate the infiltration of oil in partly saturated sand. In order to enable better monitoring of the test the experiment was performed in a two dimensional container with transparent boundaries. The width of the sand layer (height 100mm) was 30mm. As contaminant black oil was supplied via a small gap at the surface over the whole width of the model. The tests were performed at 30g. The artificial gravity influences the time scale and reduces the capillary rise, so that a freatic line can be simulated in small soil samples. The displacement of the front in time can be measured in real time using image analysis. The pixel information can be converted into distances using the known distance between key points, which are situated, in the significant area. In Fig.6a the contour of the oil plume of several stages are shown during the tests. In principle also the oil level in the supply container could be measured from digitized images, so that a comparison could be made between growing of the polluted area and oil supply.
Further details can be obtained by analyzing the grey level distribution over the area of the contaminated region. The range of the concentration lies approximately between 7% and 14%. In Fig.6b the measured concentration is presented in a three dimensional plot. A composition of four different stages is made. The freatic line and capillary zone is visible at the right hand side, where the supply container is visible at the left hand part. The decrease in height of the contaminated area shows that the concentration decreases during the course of the test, where it can be seen that the contaminant moves to the freatic surface.


a b
Fig.6 a) Digitization of the contours of the oil plumes at different stages, b) composition of the oil concentration over the plume area at four different time steps.


a b
Fig.8 Measured principal stress trajectories. a) Vertical loading, b) Combined horizontal and vertical loading. The diameter of the footing is 50mm (5 meter prototype at 100g).
5 Stress measurements
Advanced techniques are available for measuring all kind of parameters in tests. However, up to now it is still difficult to measure stresses in the interior of soil samples. Therefore the output of finite element calculations cannot be validated in detail. At this moment only an optical method based on the double refractive property of transparent granular material is available to measure stresses systematically in assemblies of granular material. In this test technique the grains themselves are used as sensors. This test technique can be applied on three dimensional assemblies of crushed glass [7], which are tested under plane strain conditions. An optical measuring technique and an automated mechanical scanning device have been developed [8,9] to obtain digital field information about the principal stress direction and the principal stress difference. In order to use this measuring technique in centrifuge research the measuring device has to be simplified. Therefore an alternative measuring method has been development where the image processing system is used to extract significant optical information from the tests [10].
A typical example of a measurement of the principal stress trajectories in tests at 100g with a circular conical footing is shown in Fig.8. In Fig.8a the footing is loaded in vertical direction, where in Fig.8b a horizontal load is applied at a constant vertical load. It is clearly visible that the principal stress directions are influenced by the horizontal load component.
6 Conclusion
Imaging technology has proven to be a valuable technique for visualizing and digitizing phenomena in experimental geotechnics. Thanks to this measuring technique tests with a small geotechnical centrifuge have become more effective. In several cases a camera and image processing software can replace mechanical displacement transducers. A camera needs less space and the light does not influence the test. The optical measuring technique is able to yield detailed deformation parameters of a large area. Measurement over a large area is also useful in centrifuge research on pollution transport phenomena. The use of a fixed non-interlaced camera enables capturing of good quality images from centrifuge tests. A fixed light source can be used in this case, which guarantees a more homogeneous illumination of the sample.
In the laboratory the technique can be used in several soil testing devices to monitor and digitize the deformation of the samples.
Image processing enables stress measurements in photoelastic granular material in centrifuge tests, so that more elementary directed research becomes possible by this testing technique.
Several applications in field tests are possible. In this paper the measurement of the deformation of a dike during water infiltration is described. Large objects can be observed, where relevant points could be digitized automatically.
The accuracy of the displacement measurement is strongly dependent on the size of the observed area. However, the accuracy can be improved simply by using more cameras. Thanks to the availability of cheap cameras this solution is not very expensive.
References
[1] Allersma, H.G.B.: On line measurement of soil deformation in centrifuge tests by image processing. 9th Int. Conf. on Experimental Mechanics, Copenhagen, (1990) 1739-1748.
[2] Allersma, H.G.B: The University of Delft geotechnical centrifuge. Int. Conf. Centrifuge94, Balkema, Rotterdam, (1994) 47-52.
[3] Allersma, H.G.B.: Development of miniature equipment for a small geotechnical centrifuge. Transp. Research. Rec. No.1432, Nat. Acad. Press Washington D.C., (1994) 99-105.
[4] Allersma, H.G.B., L. Ravenswaay, E.Vos: Investigation of road widening on soft soils using a small geotechnical centrifuge. Transportation Research Record No.1462, Nat. Acad. Press Washington D.C., (1994) 47-53.
[5] Allersma, H.G.B., F.J.A. Plenevaux, J,-F.P.C. Wintgens: Simulation of suction pile installation in sand in a geocentrifuge. 7th Offshore and Polar Eng. Conf., (1997) 761-766.
[6] Macari, E.J., J.K. Parker, N.C. Costes: Measurement of volume changes in triaxial tests using digital imaging techniques. Geot. Testing Journal. Vol.20, No.1, (1997) 103-109.
[7] Dantu, P.: Contribution à l’étude méchanique et géométrique des milieux pulvérulents. Proc. Int. Conf. Soil Mech. & Found. Eng., London, (1957) 144-148.
[8] Allersma, H.G.B.: Determination of the stress distribution in assemblies of photoelastic particles. Experimental Mechanics 1982(9), (1982) 336-341.
[9] Allersma, H.G.B.: Optical analysis of stress and strain in photoelastic particle assemblies. Ph.D. Thesis, Delft University of Technology (1987).
[10] Allersma, H.G.B., 1998: Stress analysis on photoelastic particle assemblies in centrifuge tests. Int. Conf. Centrifuge98, Tokyo, pp.61-66.
SOME APPLICATIONS OF IMAGING TECHNOLOGIES IN EXPERIMENTAL GEOTECHNICS
by: HGB Allersma
Keywords
soil mechanics, geocentrifuge, deformation, stress, embankments, image processing,
photoelasticity, soil testing.